v0.41CRISPR screens: see which knockouts actually worked →

Single-cell analysis. No code, full receipts.

A point-and-click workspace that takes you from a count matrix to annotated figures, on your own computer. An AI co-pilot explains each result, and every step is recorded so anyone can rerun it.

QC, clustering, annotation, pseudobulk DE, enrichment, integration and CRISPR screens, with the key methods checked against their reference implementations. Every step exports as a Scanpy script that runs without scView.

  • Windows, macOS and Linux
  • Free, MIT licence
  • Runs on your own computer
UMAP of 13,836 blood cells coloured by lineage: T and NK cells, monocytes and dendritic cells, B cells
Live · real data

Blood cells from 8 lupus patients, before and after interferon-β (Kang et al., Nat Biotech 2018). Hover a cell.

localhost:3000 · Unified View
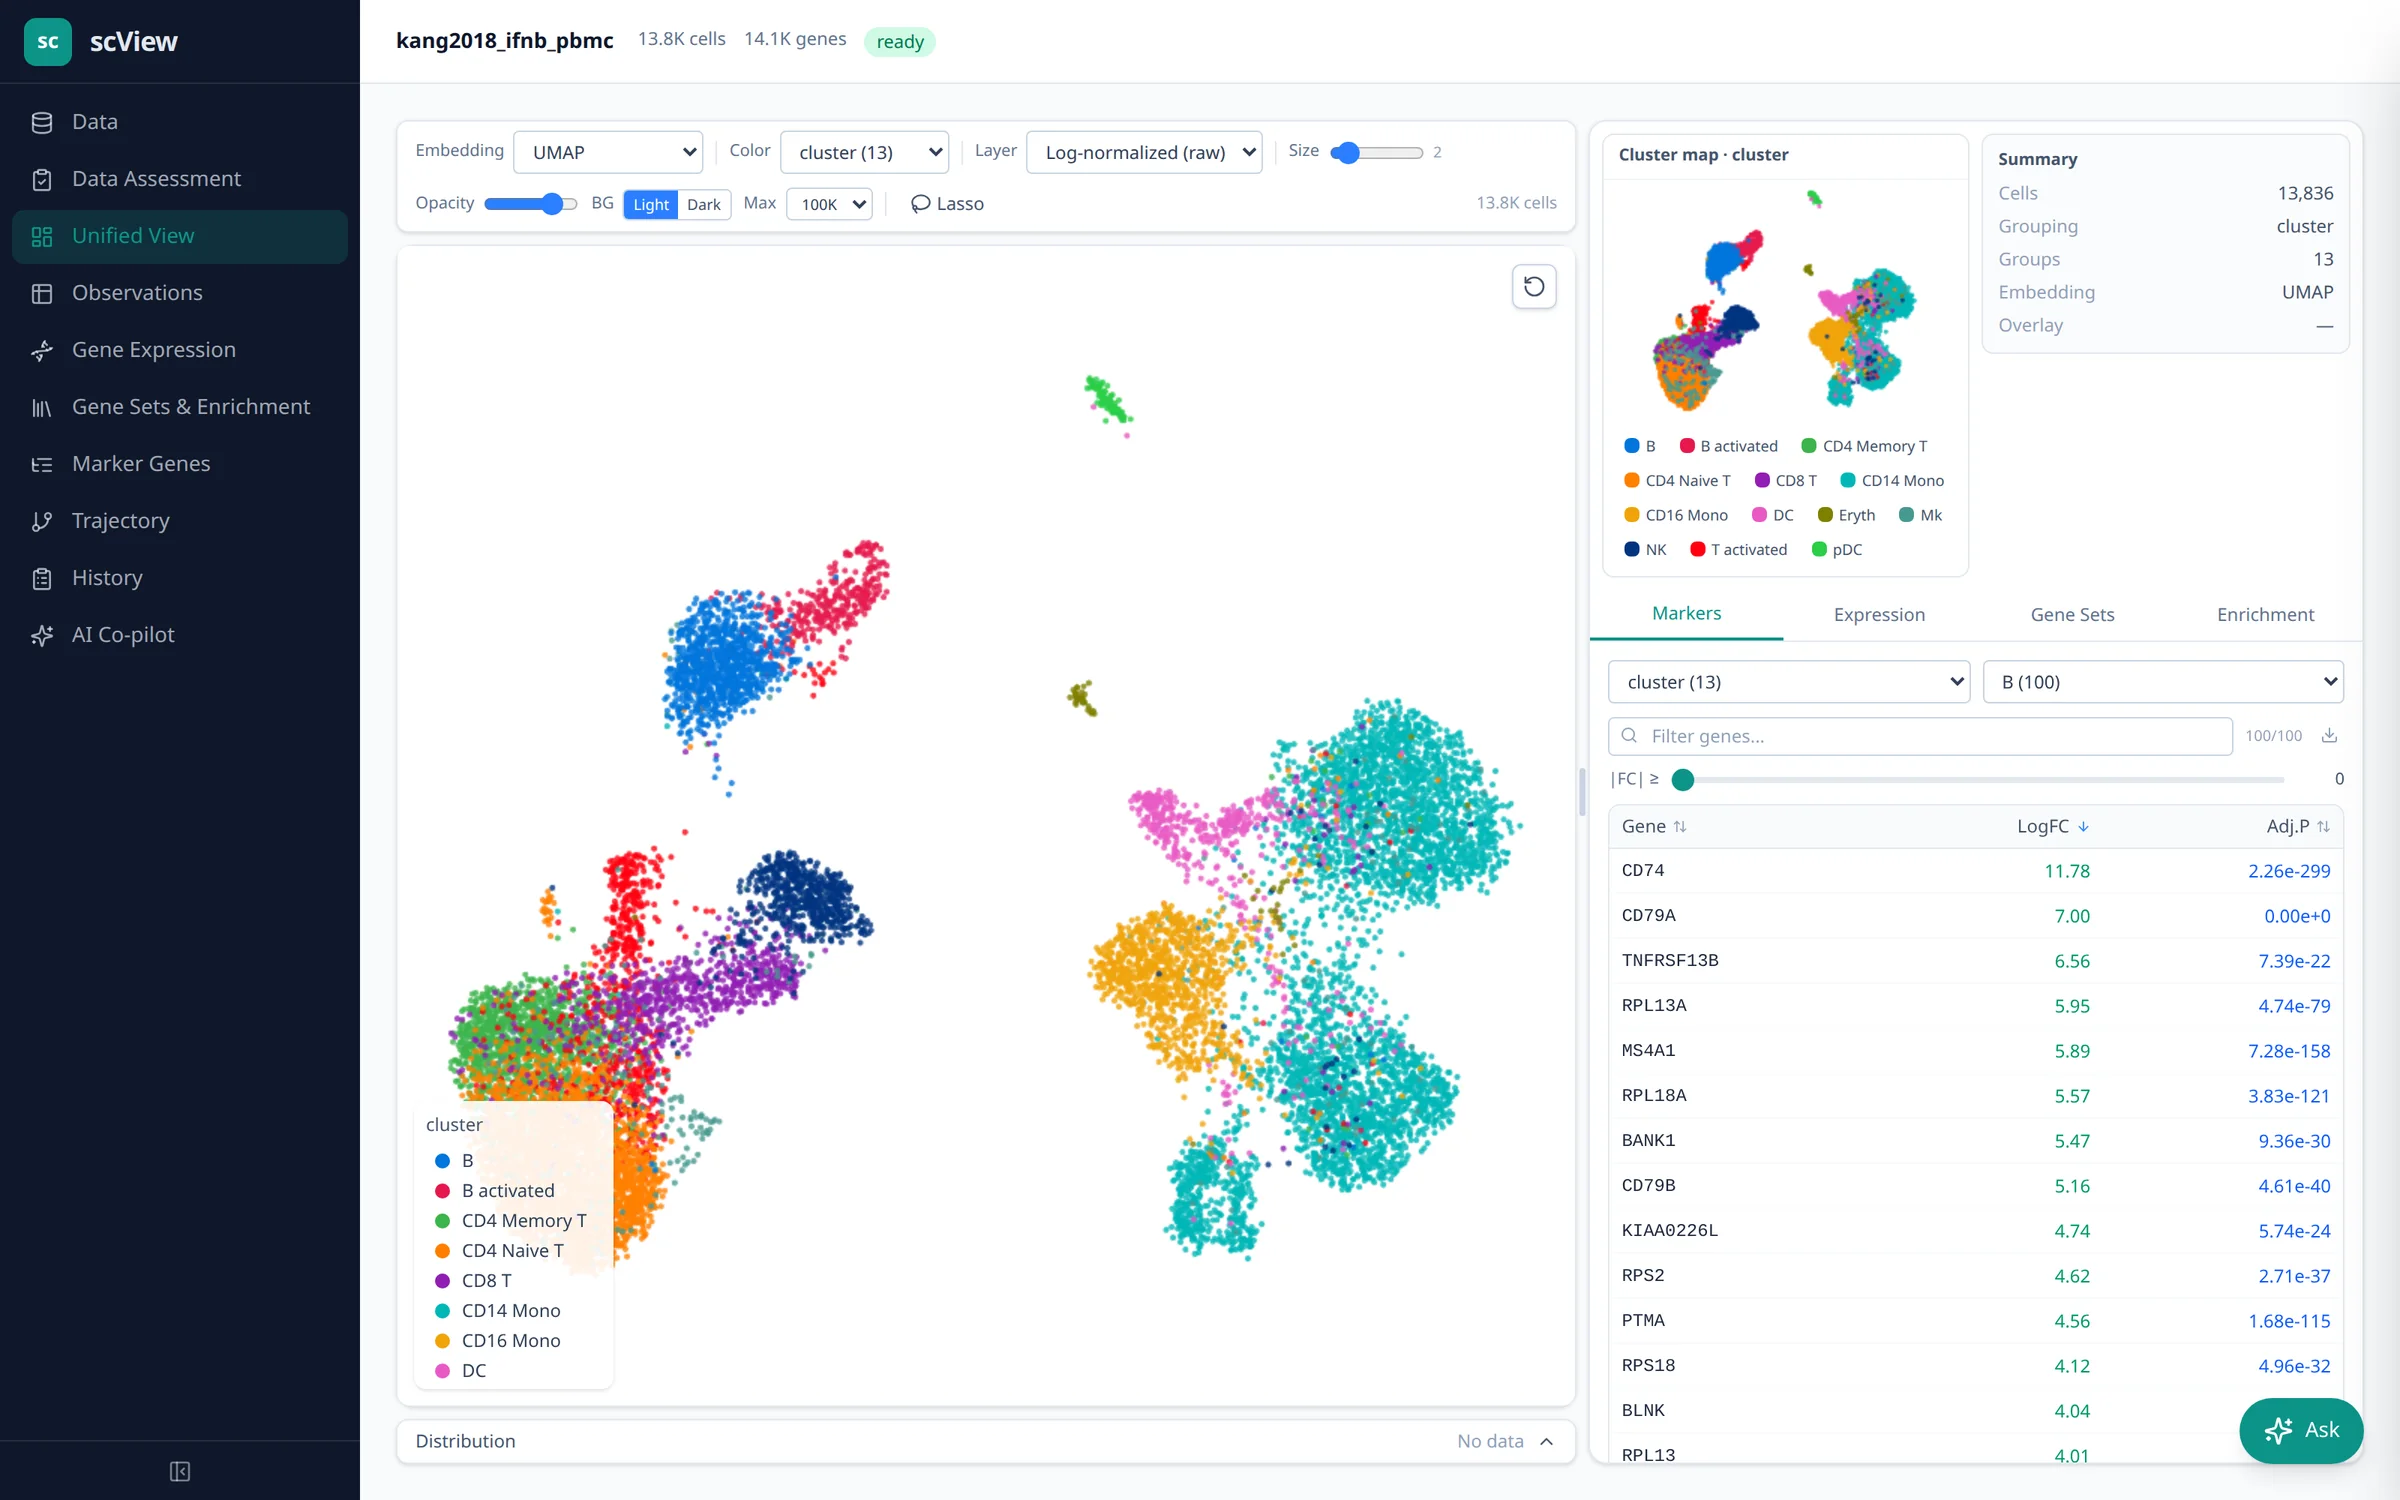
scView's Unified View: a UMAP coloured by cluster, the cluster map and a sortable marker-gene table
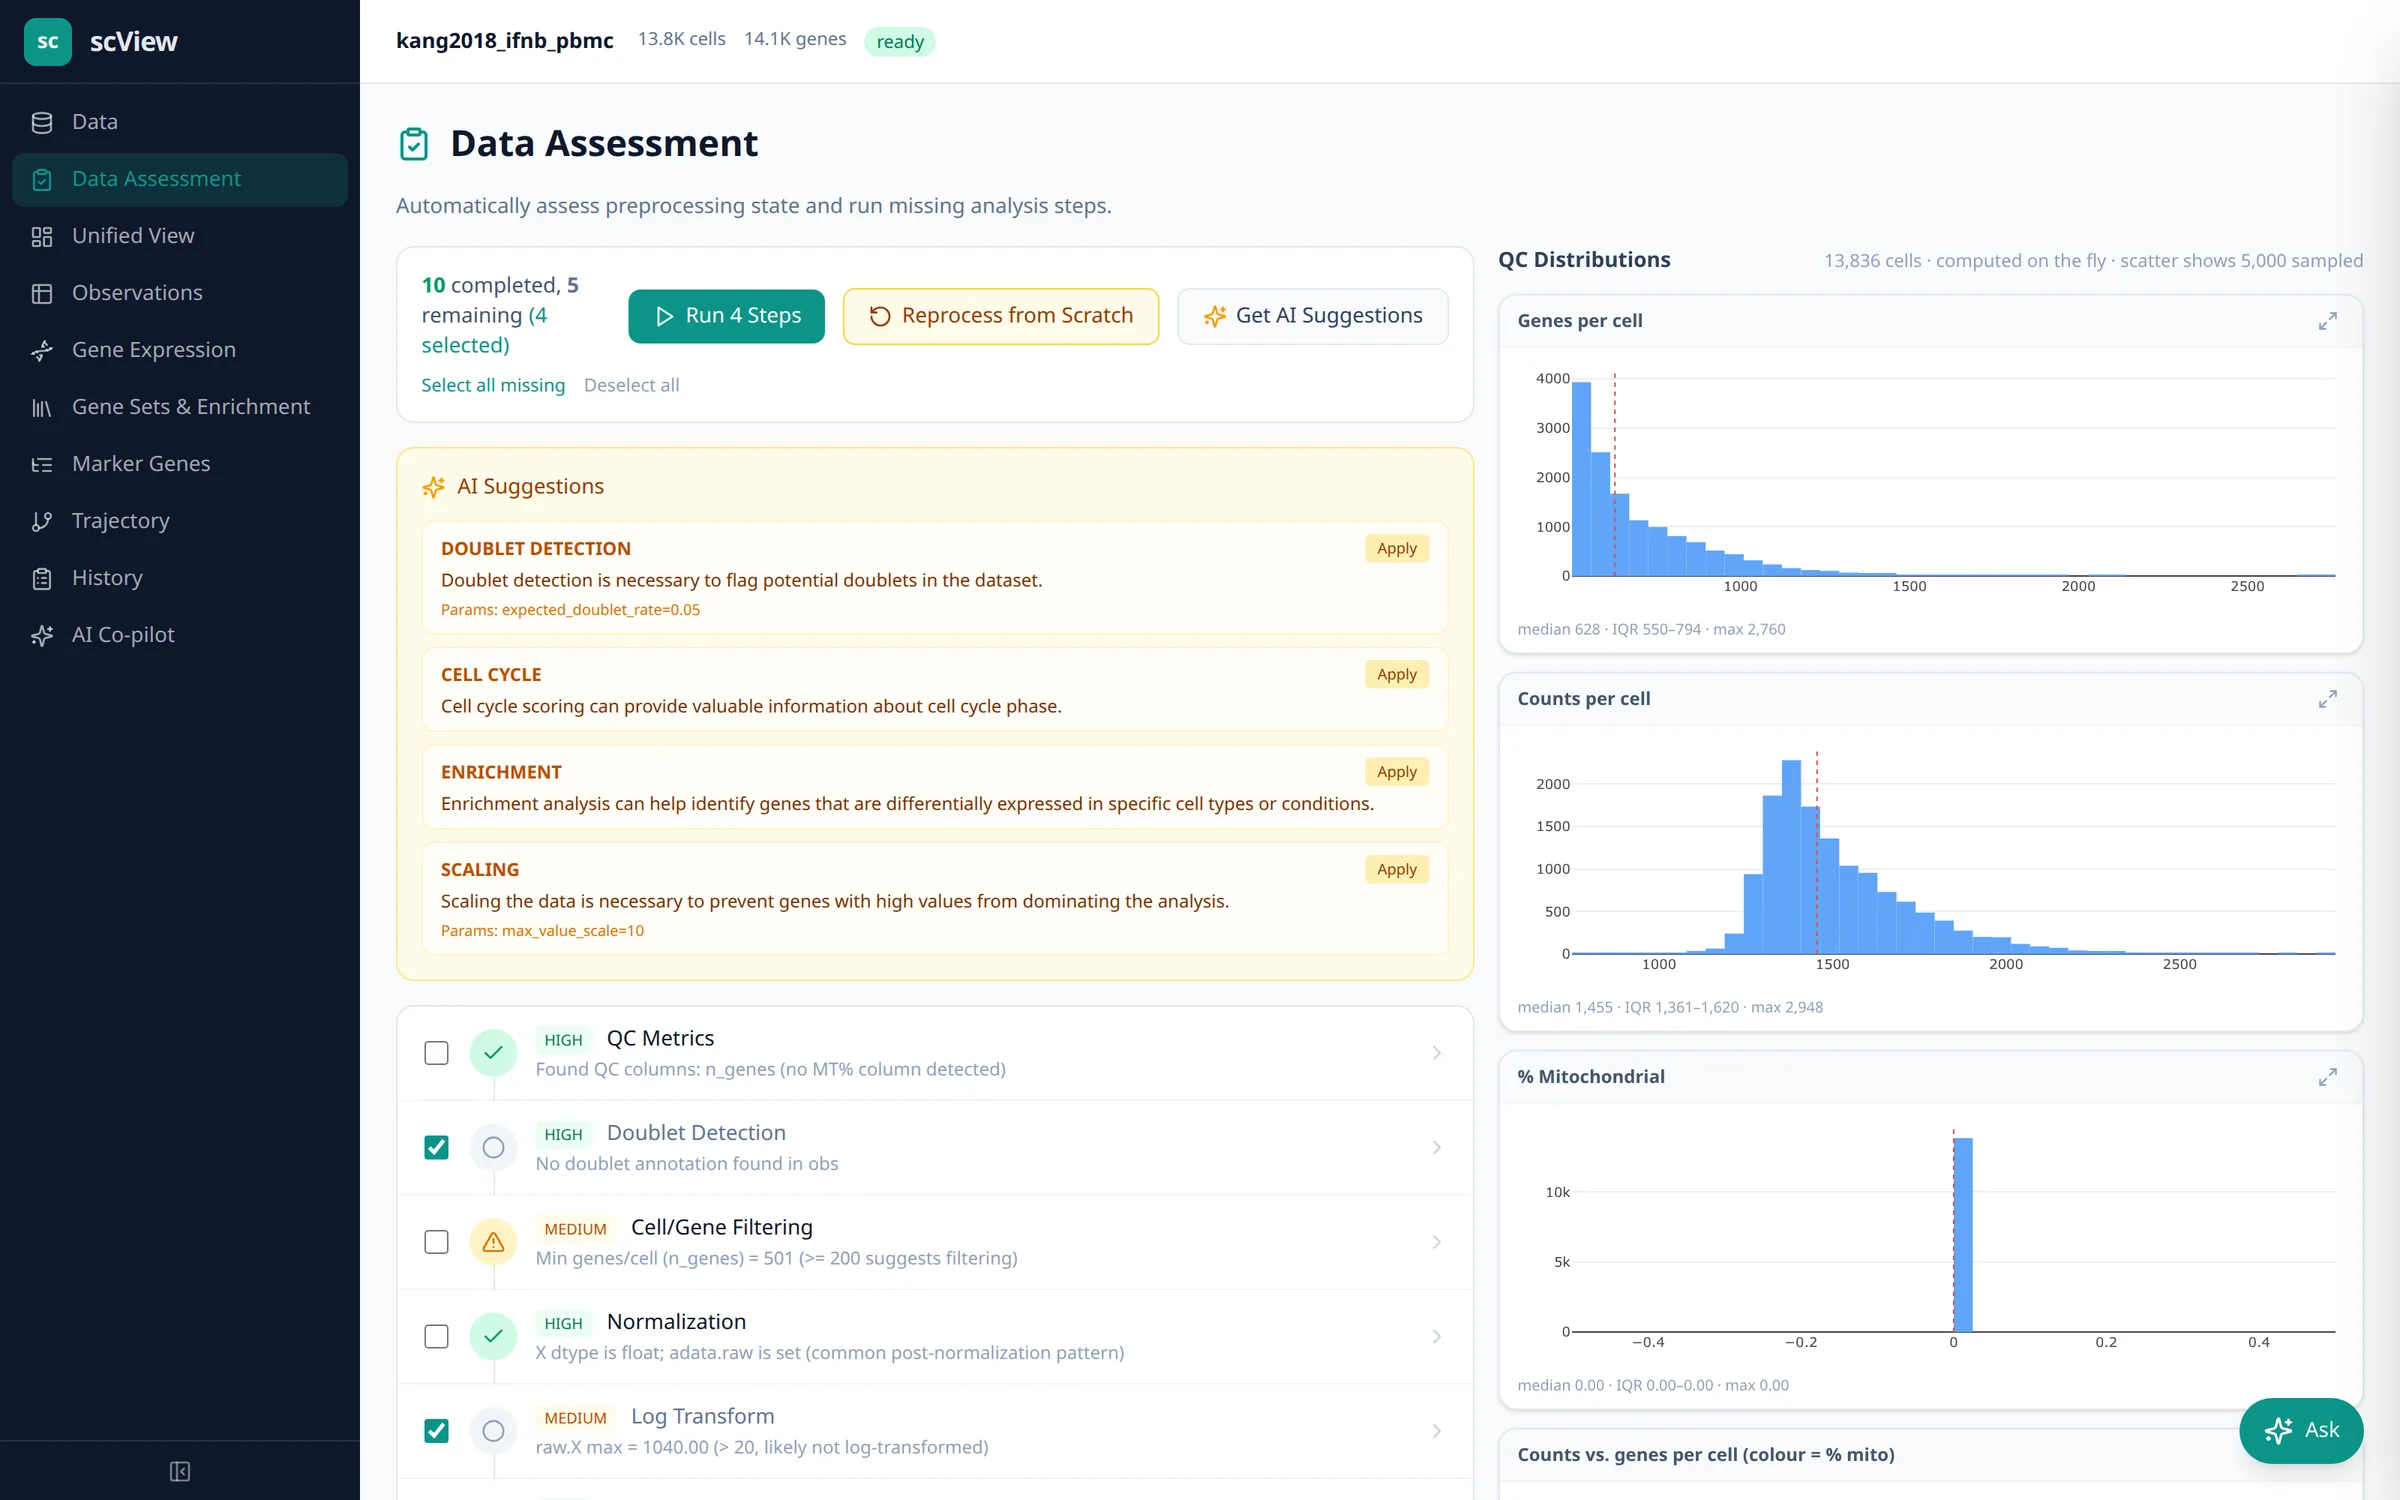
Data Assessment page with recommended processing steps and QC histograms
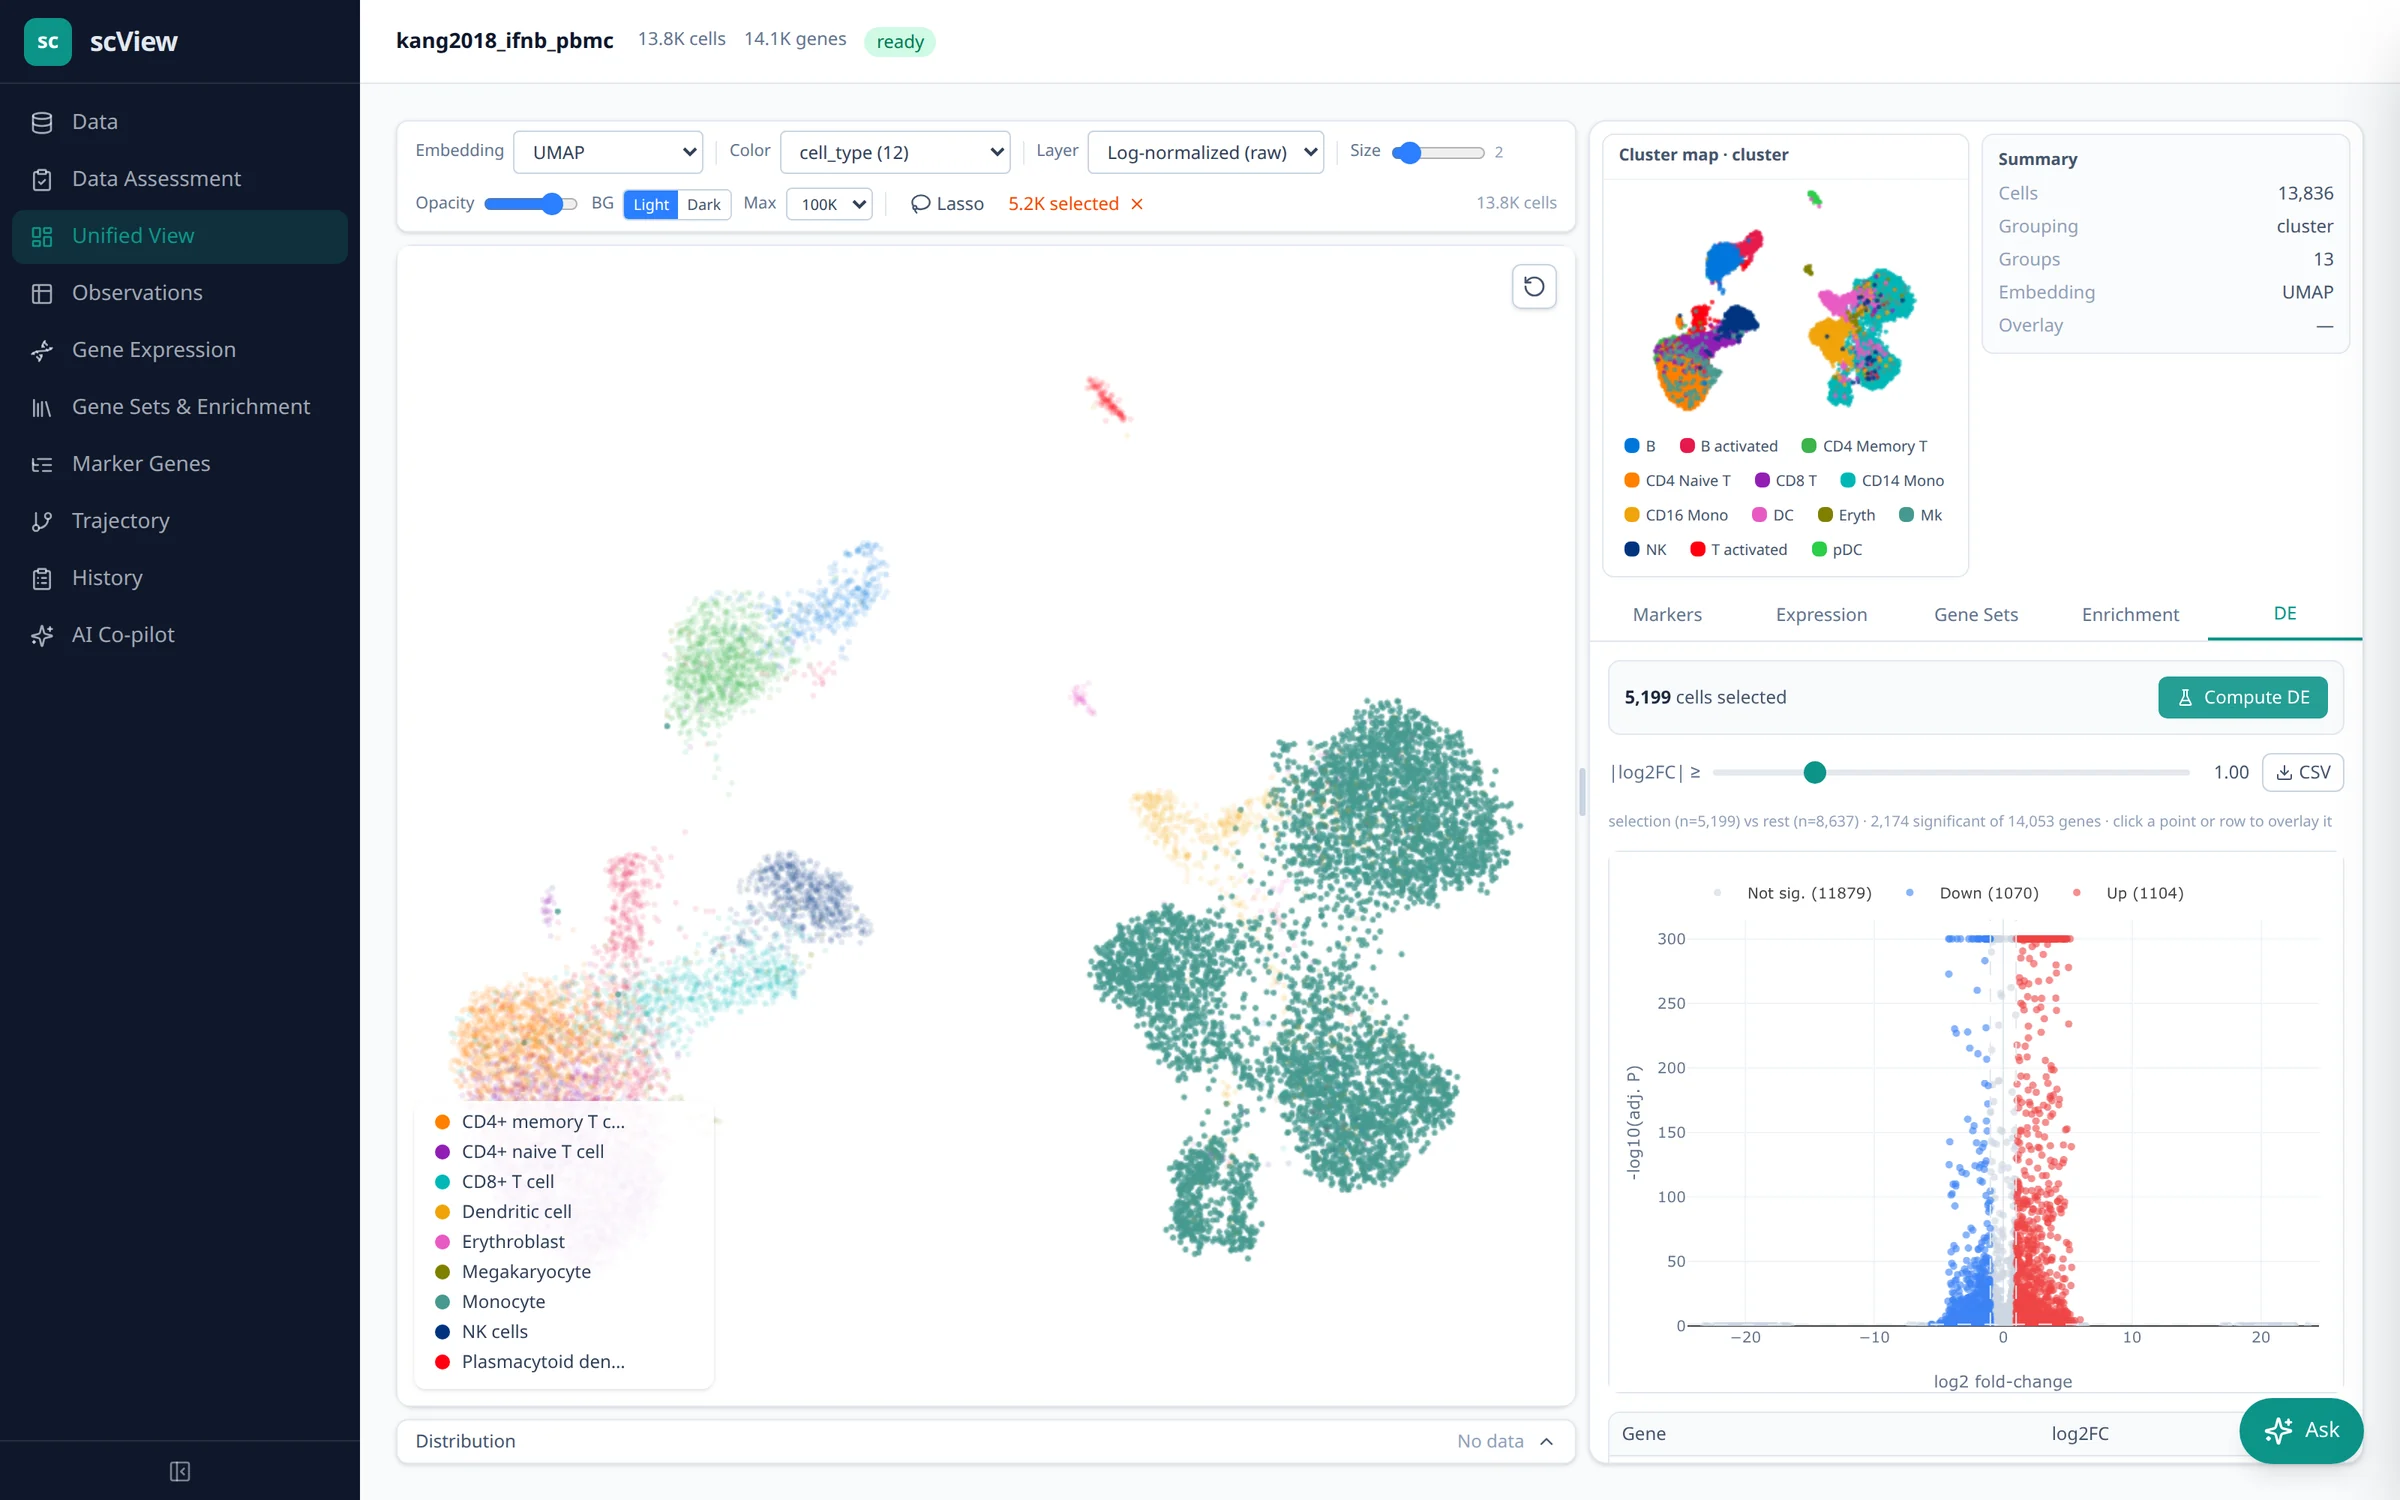
Unified View with a lasso selection of monocytes and a volcano plot of the comparison
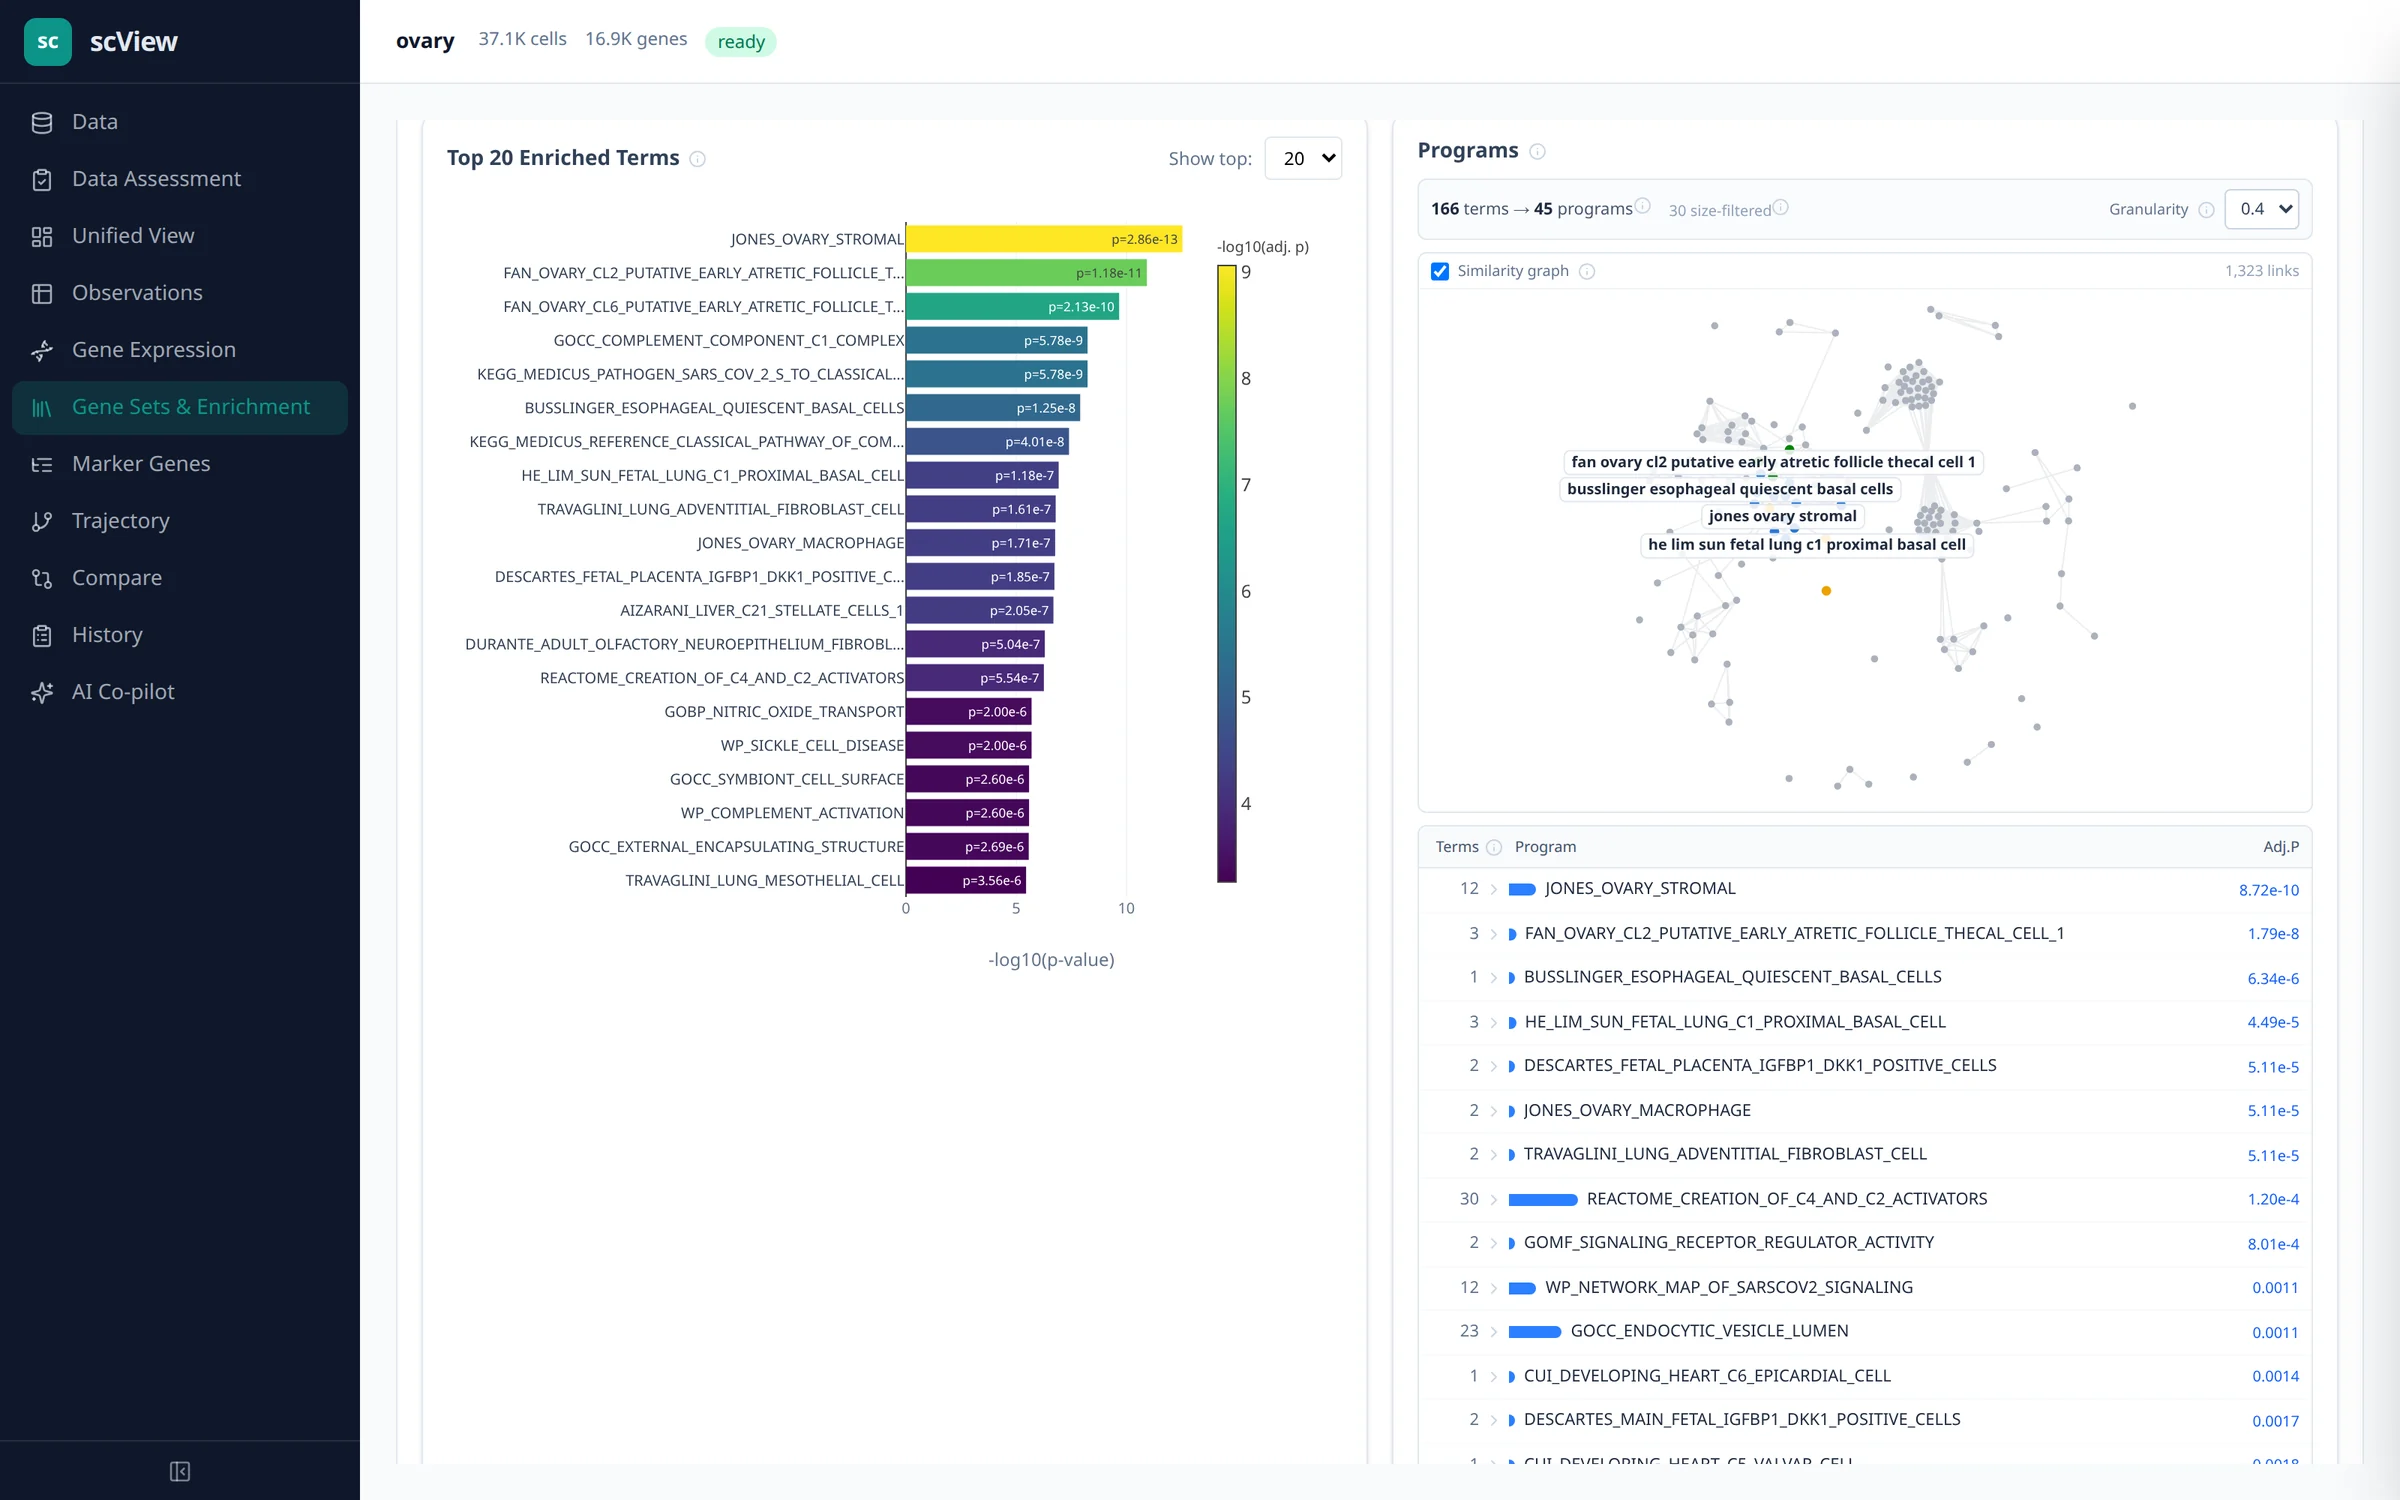
Enrichment bar chart of top terms beside a graph of programs
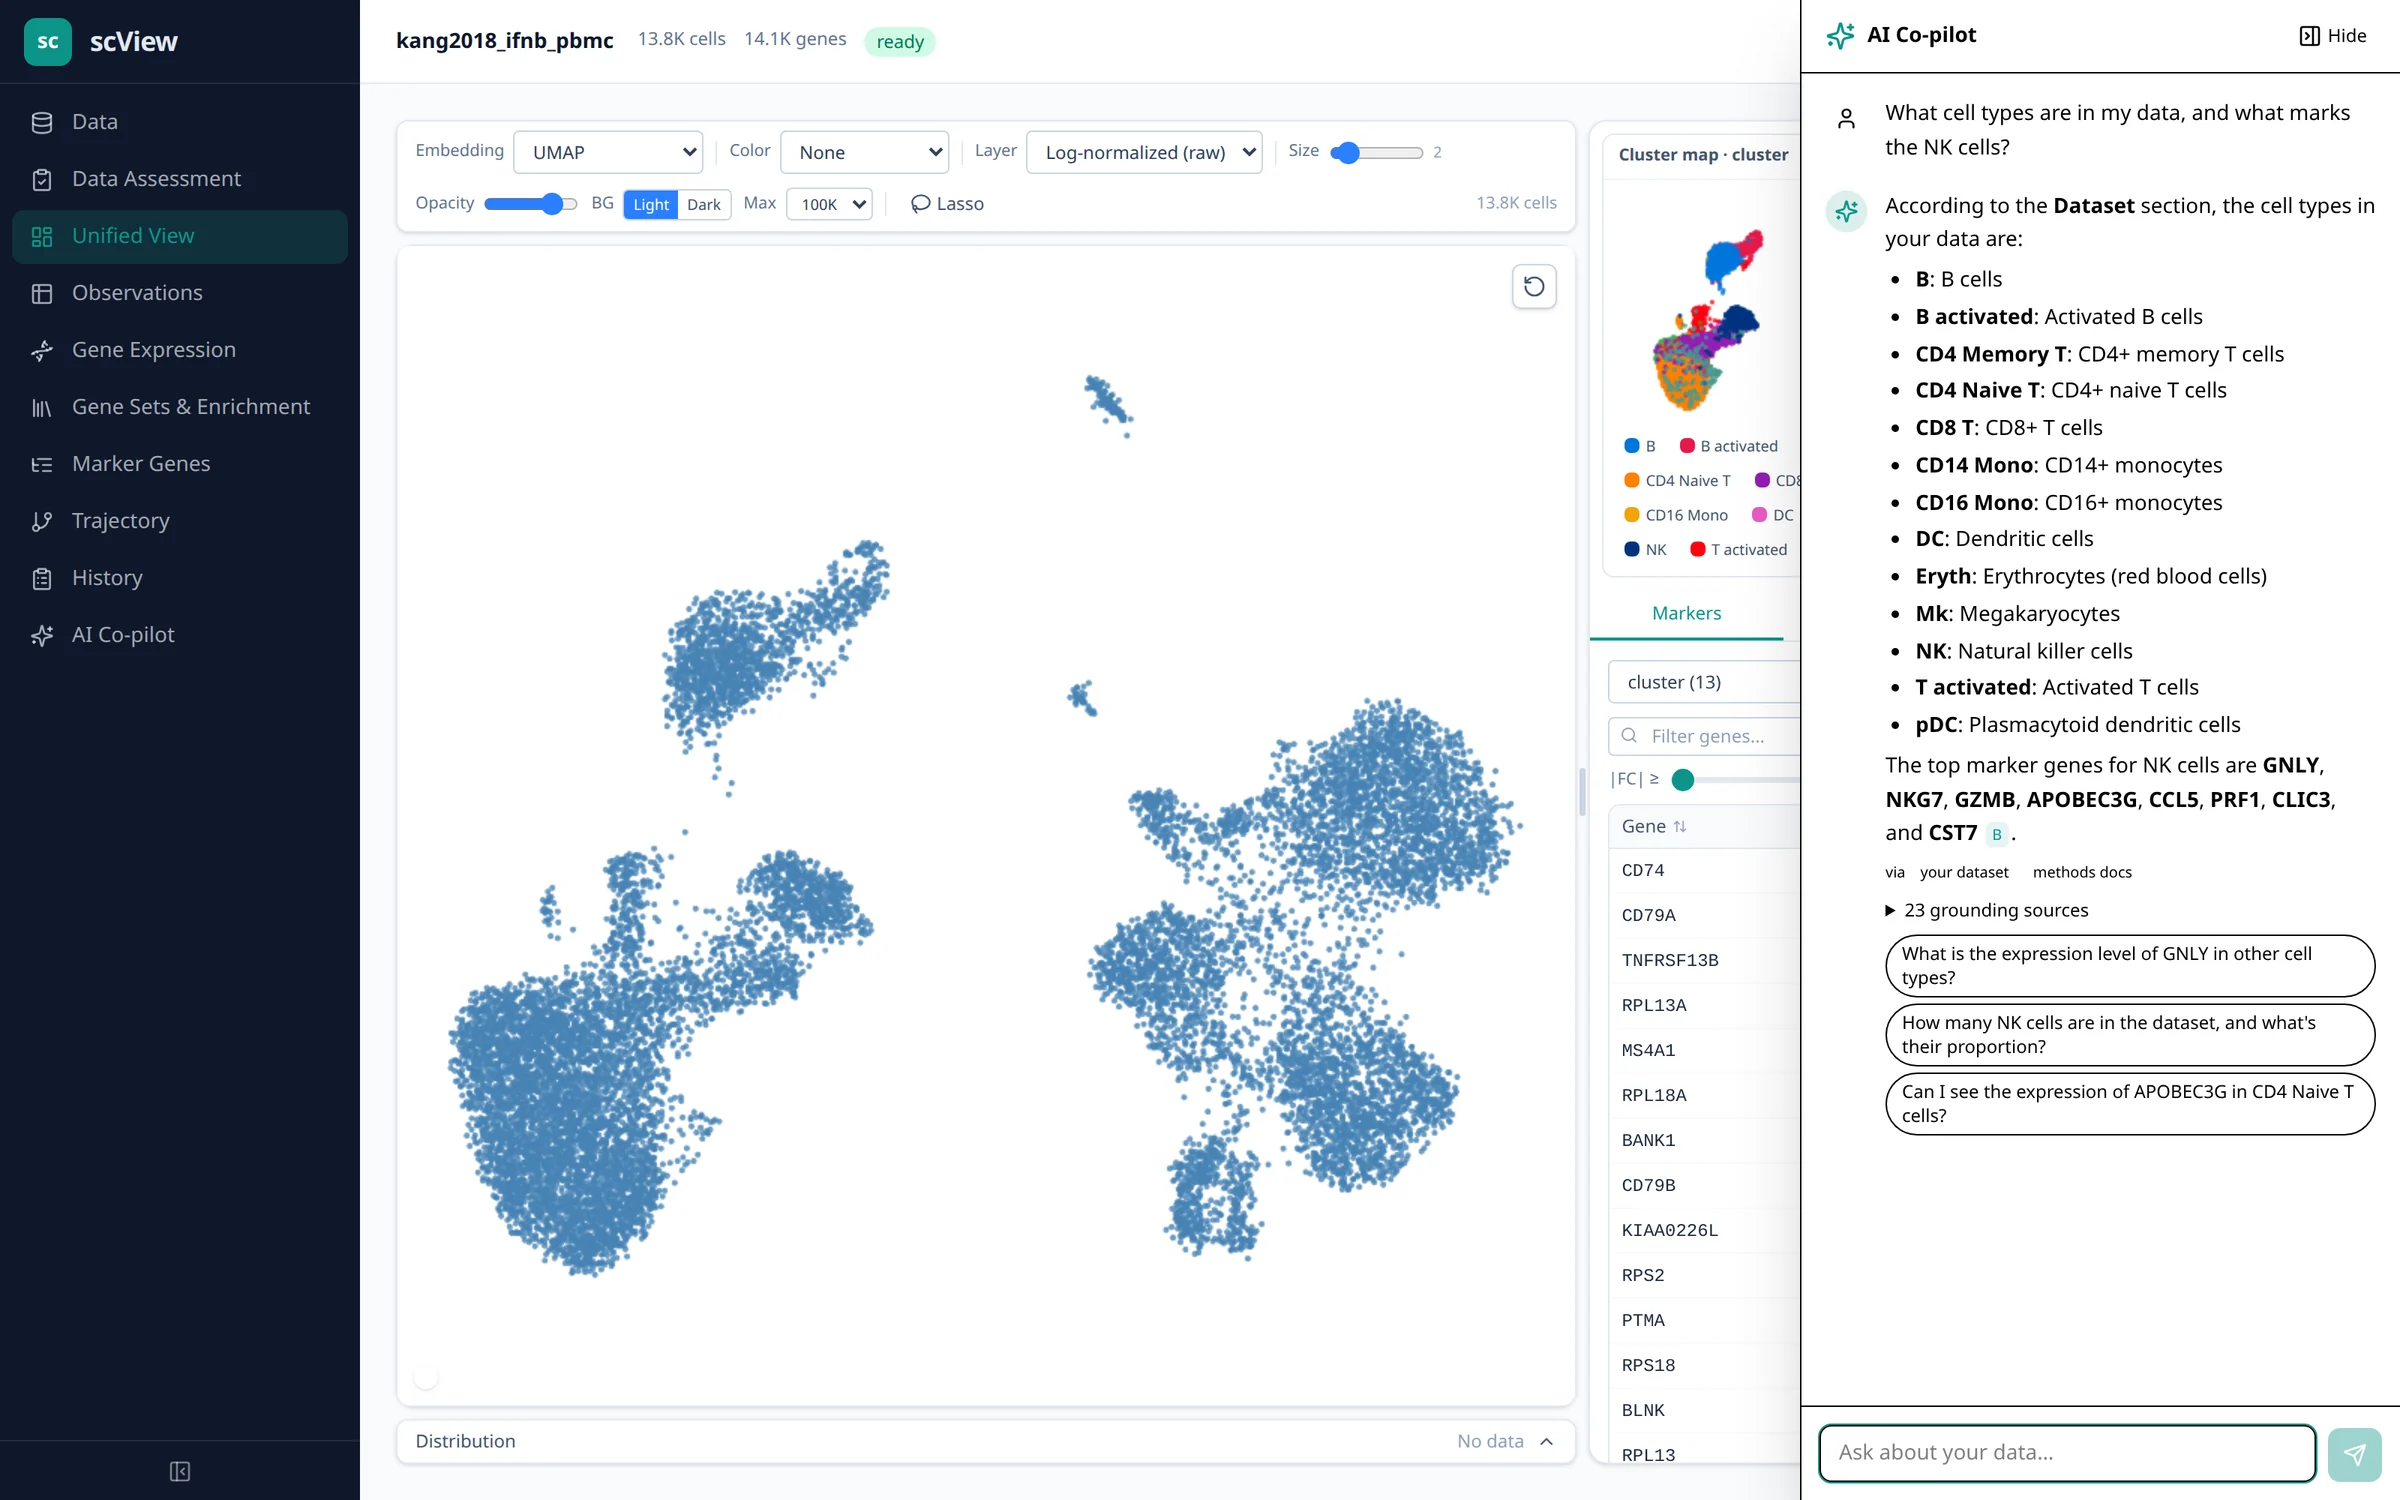
The co-pilot panel answering which cell types are in the data and what marks NK cells
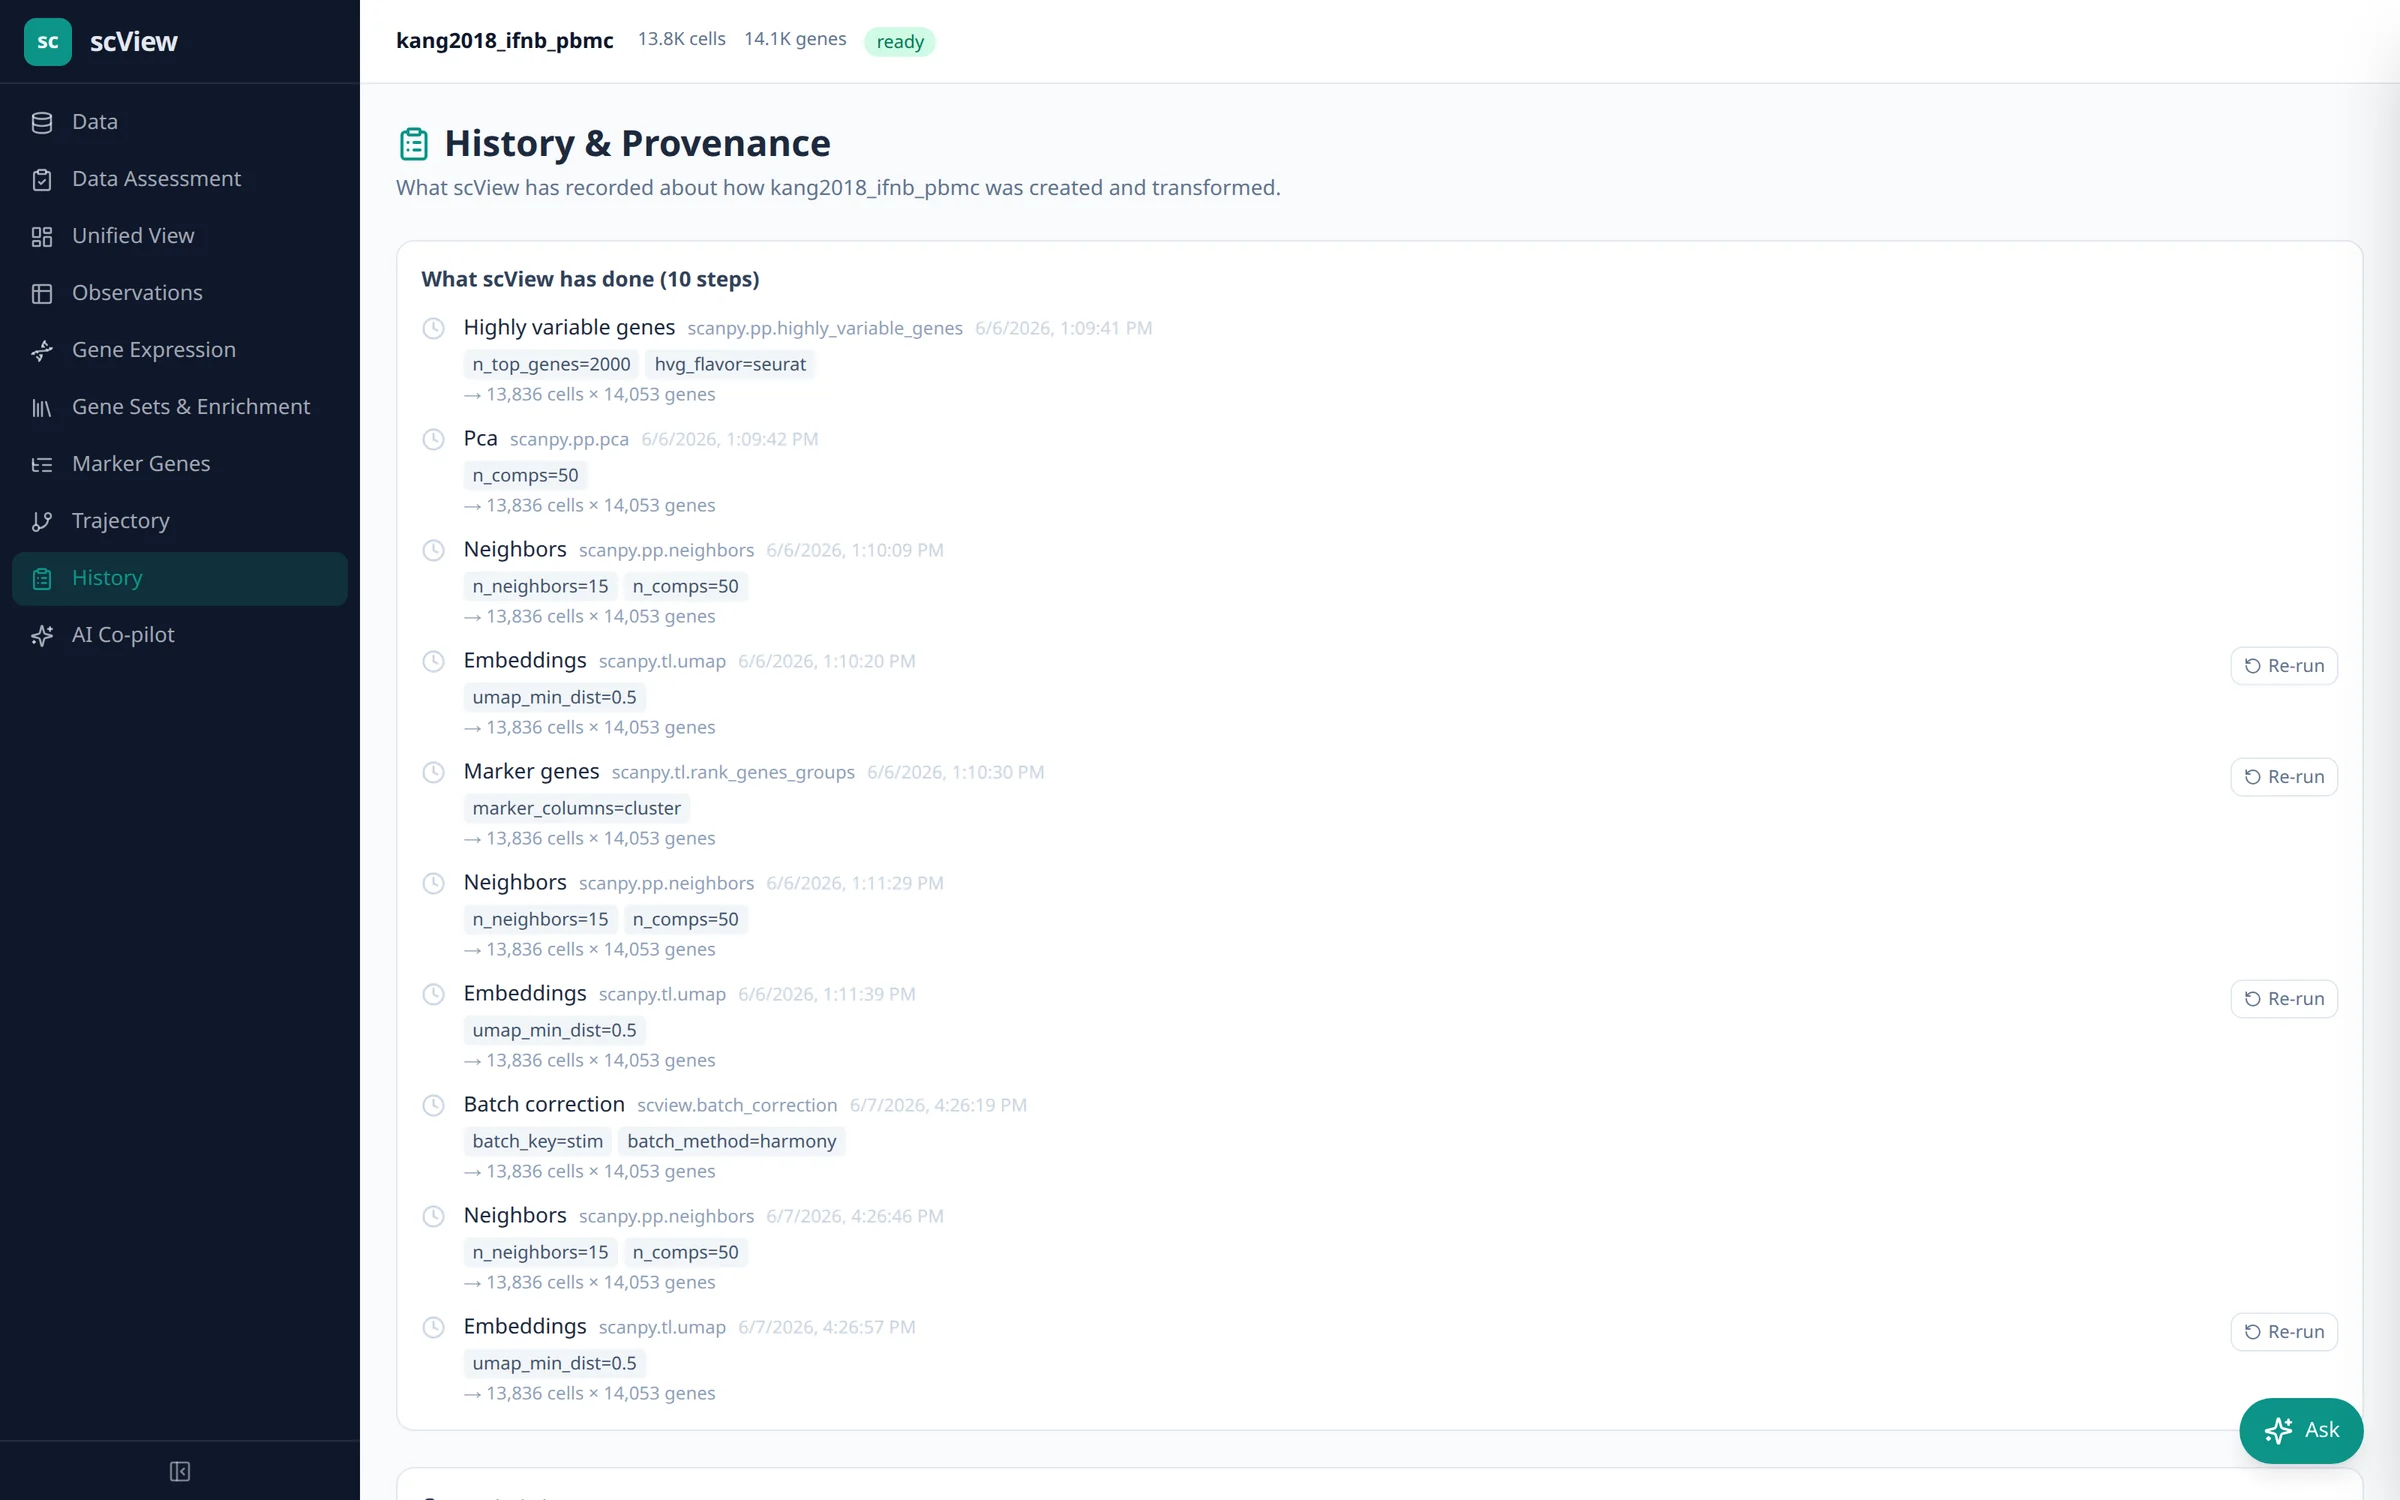
History page listing each processing step with its parameters
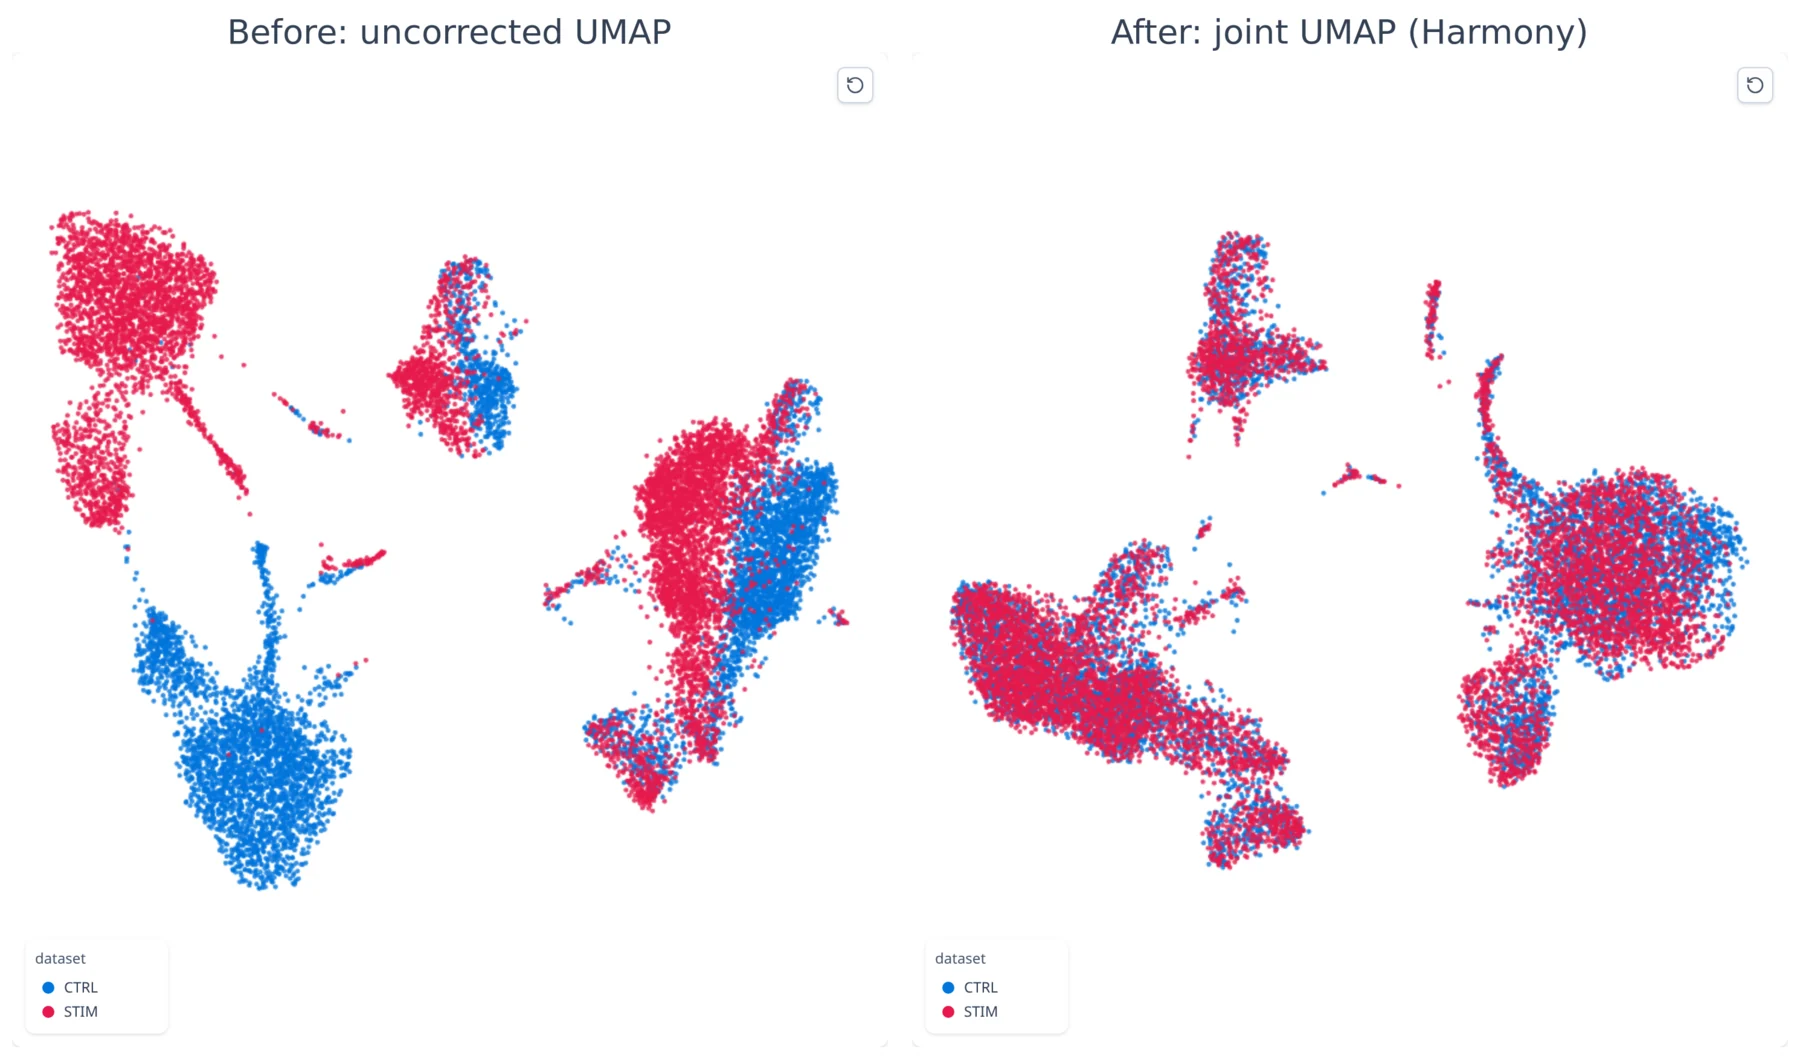
Two UMAPs: two datasets before and after joint embedding
The Unified View: map, cluster key and marker genes on one screen (Kang 2018, 13,836 cells). Click to enlarge.
How it works

The steps a bioinformatician would run, in order.

At each step scView recommends what to do and says why. You decide, and it remembers what you chose.

The same order as a Scanpy or Seurat notebook, with a recommendation and its reason at each step, and the parameters recorded for the replay script.

  1. Import

    Drop in 10x folders, h5ad, Seurat or Bioconductor files.

    Cell Ranger MEX/h5, h5ad, loom, zarr, Seurat .rds and SingleCellExperiment; CITE-seq, hashtags, TCR/BCR and CRISPR guides as side files.

  2. Check quality

    Set thresholds on the histograms, sample by sample, and see every cell you removed.

    Per-sample MAD bounds, per-type mito, Scrublet + classifier doublets, SoupX-style ambient RNA, removal audit.

  3. Group cells

    Normalise, map and cluster, then see how stable the clusters are.

    Seurat v3 HVGs or Pearson residuals, PCA diagnostics, Harmony/Scanorama/BBKNN, Leiden sweeps, clustering tree, merge check.

  4. Name them

    Marker databases, CellTypist and an AI annotator propose names; scView shows where they agree.

    PanglaoDB, CellMarker 3.0 and ACT scoring, CellTypist with gene-overlap check, conformal label-fit flags, reference mapping.

  5. Compare

    Compare conditions with each patient as a replicate, and test whether populations really grew.

    Pseudobulk DESeq2, limma-voom and RUV, paired designs, propeller-style composition, Milo and neighbourhood DE, power planner.

  6. Explain

    Pathways, cell–cell signals and a co-pilot that answers in plain words.

    ORA + preranked GSEA on MSigDB, AUCell, ULM TF activity, CytoSig, LIANA consensus, consensus NMF programs.

Features

Everything between the sequencer and the figure.

Switch “Biologist / Bioinformatician” at the top and every card explains itself again: plain language, or the method, the reference tool and the measured agreement.

Interferon response
99%

of the stimulated cells on this page switch on the interferon gene ISG15, against 29% of controls.

  • ISG15 detected (log-normalised > 0) per condition, Kang 2018.
  • DE recovers CXCL10, ISG15, IFIT1–3, RSAD2 and MX1.
  • Consensus NMF finds the interferon program unprompted (Hallmark IFN-γ, adjusted p 4e-9).
Scale
1.3M cells

A whole mouse brain, analysed end to end in 1 h 45 min. The 14,000-cell example on this page needs about 3.5 GB of memory.

  • 10x 1.3M-cell brain end to end with fast Leiden; peak about 17 GB, so give it 22 GB.
  • Streamed import: 6 minutes in 0.7 GB.
  • Memory checked before every step; a step that cannot fit stops, nothing half-saved.
Validated

Checked against the tools reviewers know

Each method was run beside its reference implementation on public data.

Numbers from scView's CHANGELOG at each release, each linked to its source.

Markerssame
Signallingsame
Cytokines.9997
CRISPR99.3%
All checks, with sources →
Quality control

Know which cells to trust

Thresholds on the histograms, sample by sample. Every removed cell stays on record, so a filter cannot quietly delete a cell type.

  • MAD bounds per sample and per-cell-type mitochondrial bounds.
  • On pbmc_1k_v3 a 10% mito ceiling removes 89% of NK cells; the removal audit shows it.
  • Doublets: Scrublet (bitwise = sc.pp.scrublet) plus a classifier (AUC 0.948 vs scDblFinder 0.951).
QC histograms of genes and counts per cell
Differential expression

Compare donors, not just cells

Compare conditions within each cell type, with each patient as one replicate, so one donor cannot make a result.

  • Wilcoxon, Welch t and logistic regression, with method agreement.
  • Pseudobulk DESeq2, limma-voom, voomByGroup and RUV (edgeR 4.10 / limma 3.68 to ~1e-9); paired designs detected.
  • A composition check flags DE that is really a shift in proportions.
Volcano plot of 5,199 monocytes, stimulated vs control
Cell types

Name them, then check the names

Marker databases, CellTypist and an AI annotator each propose names, and scView shows where they agree and where a label rests on thin evidence.

Kang13 / 13
paul1516 / 19

Cluster labels whose markers the databases support, on two public datasets.

  • PanglaoDB, CellMarker 3.0 and ACT verdicts per label: Kang 13 of 13 supported, paul15 16 of 19.
  • CellTypist with species and gene-overlap checks.
  • Split-conformal label-fit flags; cross-check by ARI/AMI and consensus labels.
Pathways and signals

Programs, not a wall of terms

Overlapping pathway hits are grouped into a few programs you can name and paint on the map.

  • ORA and preranked GSEA on MSigDB; AUCell identical to decoupler.
  • CytoSig cytokine response (Spearman 0.9997); LIANA scores = liana-py 1.10.
Enrichment bar chart and program graph
Several datasets

Put studies on one map

Bring samples and studies together, label a new sample from a reference, and see which cells do not fit.

  • Harmony, Scanorama (1.8e-6 vs 1.7.4) and BBKNN (identical to 1.6.0), compared side by side.
  • Reference mapping with a “not in reference” flag: held-out B cells 36% vs at most 4% elsewhere.
  • Export to CELLxGENE (schema 7.1.0) and Vitessce.
Two datasets before and after joint embedding
AI co-pilot

Ask in plain words, get sourced answers

Ask about your data the way you would ask a colleague. Answers come from your own results and the literature, and each sentence shows where it came from.

  • Grounded in the dataset's results and provenance plus a methods and literature corpus.
  • Claims check: across 23 answers, 126 of 194 claims confirmed by rule, none refuted.
  • Optional: needs a DeepInfra key; rule-based guidance without one.
The co-pilot answering which cell types are in the data and what marks the NK cells
Reproducible

Every step on the record

Each step is saved with its settings. Export the whole analysis as a script a colleague can run without scView.

  • The replay script reproduced cells, HVGs, clusters, PCA/Harmony/UMAP and markers exactly on Kang and paul15.
  • RUN_MANIFEST records the input file's SHA-256.
  • Earlier marker and enrichment results are kept per dataset, to compare or restore.
History page listing each processing step with its parameters
New in 0.41

CRISPR screens

99.3% same class as pertpy

See which knockouts actually worked, cell by cell, and what changed in the cells where they did.

  • Guides from Cell Ranger's protospacer calls or guide counts.
  • Mixscape KO / NP classes: same class as pertpy 1.0.3 for 99.3% of Papalexi cells (20,729 cells, 25 targets).
  • LDA view and KO vs control DE.
More than RNA

Clonotypes, proteins, hashtags

20,238 cells, same call as R

T- and B-cell receptors, surface proteins (CITE-seq) and sample hashtags, read alongside the RNA.

  • Clonotypes match scirpy 0.22 one-to-one.
  • HTODemux and hashedDrops: the same call as R for all 20,238 GSE108313 cells.
  • Protein CLR per cell, as Seurat does.
Your computer

No account, no cluster

±20% memory estimate, before each step

It runs on your own machine. scView checks the memory a step needs before running it, and stops a step that cannot fit instead of freezing the computer.

  • Docker or Podman; amd64 and arm64 images.
  • Preflight estimates within 20% of peak memory on six datasets (1,222–37,104 cells).
  • Watchdog and Cancel on long runs.
Validation

Checked against the tools you already trust.

Before a method went into scView it was run beside the tool reviewers expect, on public data. These are the measured agreements.

Agreement with the reference implementation on public datasets, as recorded in the CHANGELOG at release. “To 1e-13” means the numbers agree to 13 decimal places.

to 1e-16
Ambient RNA
Background RNA in every droplet.R SoupX 1.6.2: soup profile; adjustCounts to 5e-11. 10x pbmc, heart and neuron 1k.
Identical
Doublet scores
Droplets that hold two cells.sc.pp.scrublet (scanpy 1.11), bitwise. Kang 2018, paul15.
0.948
Doublet classifier
A second, independent doublet call.AUC; R scDblFinder scores 0.951. 10x human + mouse mix.
Every cell
Sample hashtags
Which sample each cell came from.same class and tag as Seurat 5.1.0 HTODemux and DropletUtils 1.24 hashedDrops. GSE108313, 20,238 cells.
Identical
Marker genes
The genes that define each group.scanpy rank_genes_groups (Wilcoxon, t-test). 100k cells in 15 s instead of 2.5 min.
to 1e-9
Pseudobulk limma-voom
Gene changes with donors as replicates.TMM, voom and moderated t vs edgeR 4.10 / limma 3.68. Kang 2018.
Exact
Cell-type proportions
Did a population really grow?.propeller-style test vs R limma, “to numerical precision”. robust eBayes.
0.9997
Cytokine response
Which signals drive a response.Spearman of z-scores vs CytoSig 0.0.3. Kang: 13 cell types × 43 cytokines.
Identical
Cell–cell signalling
Which cells talk to which.liana-py 1.10 method scores, CellPhoneDB p, specificity rank. Kang 2018, paul15.
99.3%
CRISPR screens
Which knockouts actually worked.same class as pertpy 1.0.3 Mixscape (99.65% with exact neighbours). Papalexi 2021, 20,729 cells, 25 targets.
All 19 checks, with sources →Each number links to the release note or code that recorded it.
Straight answers

What scView is not.

Not a cloud service

It runs on your computer and there is nothing to sign up for. The optional co-pilot sends your question and the relevant results to the model provider you configure.

Not unlimited on a laptop

About 3.5 GB handles the 14,000-cell example and 16 GB is recommended. The 1.3-million-cell brain needed about 17 GB, on a server.

Not a public web server

It is built for one person on localhost, with no login. Do not expose it to the internet as it is.

Install

Running in about half an hour.

Most of that is downloading. scView runs in Docker or Podman, so there is no Python, R or Node to install.

Windows

Double-click to start

Install Docker Desktop, download scView, then run:

start-windows.bat
macOS

Docker Desktop

Then in a terminal:

git clone https://github.com/thirtysix/scView cd scView && ./start.sh --prod
Linux

Docker or rootless Podman

Then:

git clone https://github.com/thirtysix/scView cd scView && ./start.sh --prod
3.5 GB memory for 14,000 cells16 GB recommended10 GB free disk for the first startDocker Compose 2.24+ or Podman Full guide: Windows step by step, Podman, troubleshooting →